Over the last few months, I have been turning myself into a superhero. Not a very good one though, as the only person I can save is myself and my special powers are the ability to bleed, spit and defecate. But by collecting my bodily fluids to measure aspects of my biology – ‘biometrics’ – and tracking my activity, I have become ‘Metric Man’.
Using technology to quantify your life, known as ‘self-tracking’ or ‘quantified self’, has become easy thanks to the availability of affordable wearable devices and direct-to-consumer tests. For example, the price of sequencing a whole human genome has dropped dramatically: in 2003 it cost scientists $3bn to read almost every letter in our DNA, but today a company will do it for just £150.
Dozens of companies are offering to analyse everything from epigenetics to the microbiome to help inform decisions on lifestyle changes that might improve your health. Are those firms selling personalised medicine, or snake oil? To answer that question, I’ll share what I’ve learnt from six months of self-tracking.
First, a bit about the guinea pig. I’m almost 40, fit and relatively healthy. My diet contains too much junk food. I usually cycle 30 minutes per day, practice martial arts three to four times a week and go running with my dog twice a month.
To track daily activity, I wore a Fitbit device almost 24 hours a day, only taking it off for karate classes (for safety) and charging. Tracking shouldn’t completely take over your life, so I didn’t log my food, water intake or body weight. Later, the calendar, messages and photos on my phone let me figure out what I was doing on a particular day and how that was reflected in my daily activity.
Read more about health tracking:
- What is the most accurate type of biometric identification?
- Where next for wearable tech?
- Health tracking tattoos could help diabetics
To assess what biometric tests can detect, I ran a little science experiment and sampled my bodily fluids on three dates over the six-month period (12 April, 18 June and 13 August 2019). The first and third collections were done in a typical week, with normal exercise and diet. But the second set was different: the tests were done the day after a brutal four-hour grading exam for a black belt in karate.
The exam was preceded by a month of intensive training and two weeks without alcohol. I controlled for as many variables as possible and my blood, saliva and stool samples were all collected within a one-hour window, which required prior planning and a cup of coffee.
My hypothesis was that at least some results from the second set of tests would differ from the first and third measurements.
1
Daily activity tracking
Fitbit tracker / From £50 / Turnaround: 1 day
Activity trackers use an accelerometer to count your steps and determine the distance you’ve travelled by multiplying steps by your stride length. They also use an altimeter to measure the number of floors you’ve climbed.
The amount of calories burned comes from an estimated ‘basal metabolic rate’ or BMR (how hard your metabolism works to maintain the body at rest, according to age, height and weight).
Fitbit’s smartphone app shows five default goals for physical activity: 10,000 steps, 10km distance, 10 floors and 30 active minutes (all semi-arbitrary targets not supported by science) plus a goal for calories burned based on BMR.
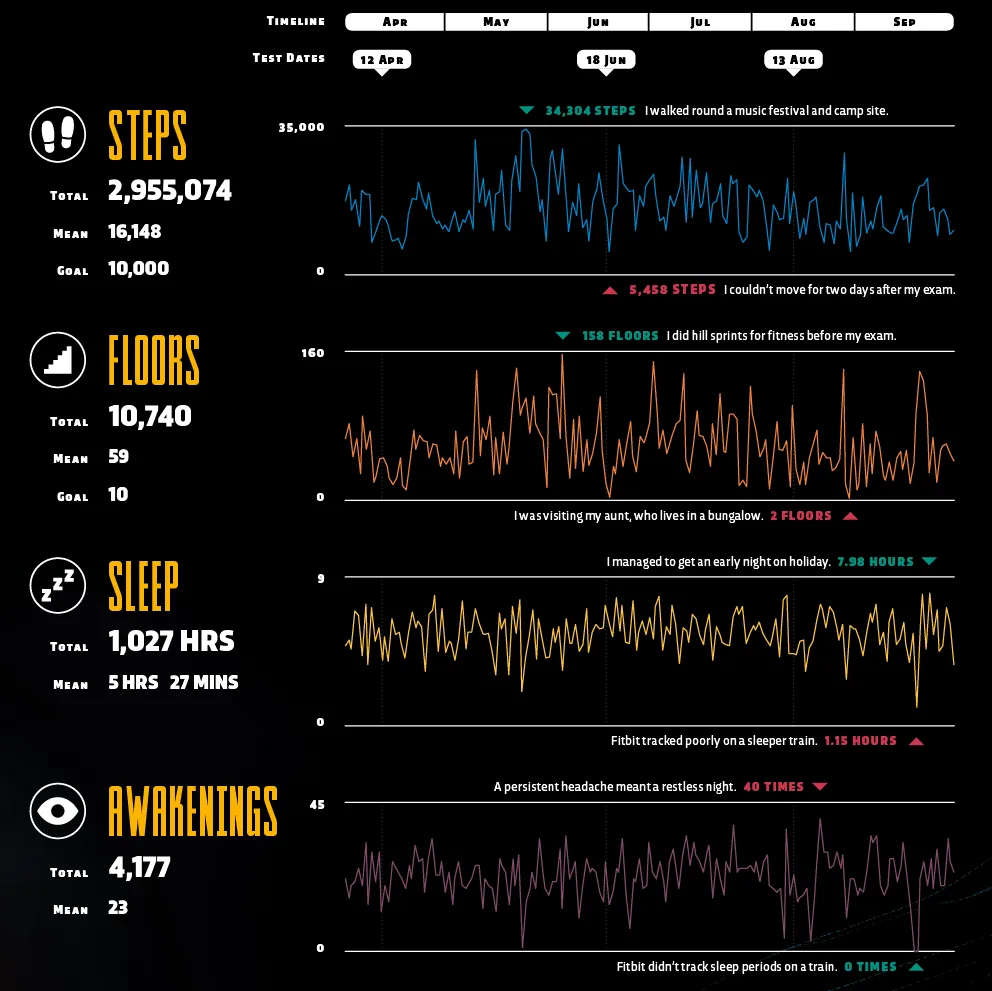
Fitbit uses algorithms to estimate sleep via activity sensors or ‘activigraphy’. In contrast, professional sleep researchers use multiple indicators – including rapid eye movement (REM) and brain waves via an electroencephalogram (EEG) – to get readings.
“We define sleep as the EEG signature, the rhythmic firing of the neurons,” says psychologist Dr Kelly Baron, who specialises in sleep medicine at the University of Utah. “If you’re estimating it based on movement and heart rate, it’s not as good.”
Fitbit recently added sleep stages (awake, REM, light and deep sleep), which isn’t actionable data as you can’t really force your brain to get more REM, only more sleep in total.
What do activity tracker biometrics say about me?
The most surprising figure from my daily activity is that, on average, I only slept 5.6 hours a day. As a consequence I now lie awake at night, worrying about how I should be asleep.
I’m not alone: in 2017 Baron, described a condition called ‘orthosomnia’ where people obsessively track their sleep and fret about how much they get.
“We defined orthosomnia as overemphasis or a fixation on having perfect or ‘right’ sleep,” says Baron, who thinks the public health benefits of trackers outweigh such costs. “There’s a potential to use these devices to increase sleep duration.”
2
Genetic testing
23andMe / From £79 (special offers often available) / Turnaround: 2-3 weeks
Veritas Genetics / From $599 (£455 approx) / Turnaround: 2-3 months
Chronomics / £TBC / Turnaround: 2-3 months
Genetic testing involves extracting DNA from cells of your mouth, found in the saliva sample you send to a lab, then detecting genetic variants by one of two methods.
The first is genotyping, which cuts up DNA then adds the fragments to a microchip covered in fluorescent probes matching a selection of variants, like scattering glitter over paper dotted with glue to see what sticks. This is what 23andMe does.
The second method is sequencing, which uses chemical analyses to read each letter in your DNA sequence. Whole-genome sequencing, done by Veritas Genetics, reads almost 6.4 billion letters along your 23 pairs of chromosomes.

Epigenetic testing is like genetic sequencing, except DNA is first chemically treated to highlight the location of ‘epigenetic marks’ along your chromosomes. Those marks are often chemical tags attached to DNA controlling whether genes are turned on or off, analogous to using a pencil to cross-out a few sentences or even entire pages in your body’s instruction manual.
As environmental factors like smoking affect whether you have marks at certain points on DNA, epigenetics can indicate your current health status. One firm, Chronomics, uses the presence of epigenetic marks on specific genes to estimate your ‘biological age’.
Disease Risks
Your risk of developing a disease is estimated from whether the genetic variants you carry are common within a database of people with similar demographics. Both 23andMe and Veritas Genetics predict that I have an increased risk of late-onset Alzheimer’s disease (they predicted 20-25 per cent risk for me, versus 10-14 per cent for men) which worried me as my paternal grandfather developed dementia.
But the environment should also affect my chances. “There are other things that need to happen in order for that disease to manifest itself,” says Rebecca Hodges, lead genetic counsellor at Veritas.
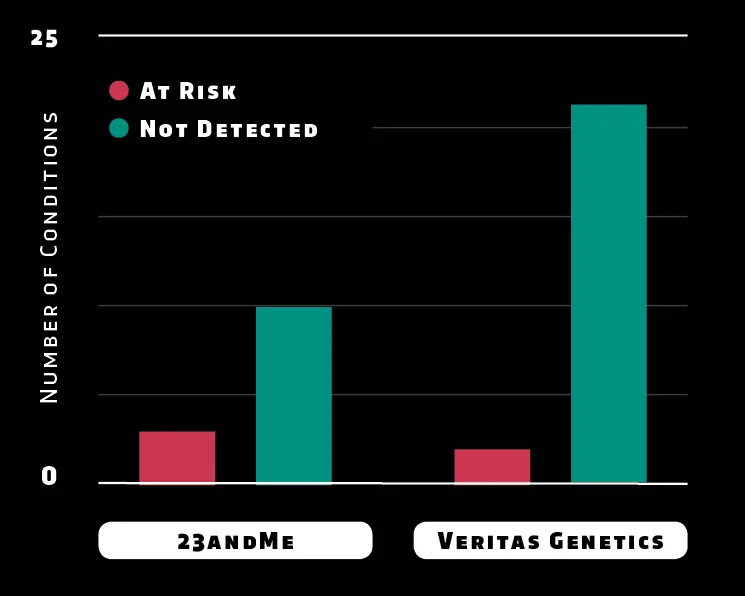
Sequencing generates a massive amount of data: if your DNA letters were printed on paper, genotyping would cover hundreds of pages while sequencing would mean thousands of books. Genotyping is also a one-off test while sequencing lets you re-read DNA to identify more variants later. In some cases, like susceptibility to cancer, you may be able to take action to help prevent disease.
Veritas’s standard package scans for variants in 59 genes associated with conditions the American College of Medical Genetics and Genomics considers ‘actionable’– the challenge is understanding how your variants are relevant, says Hodges. “We have a team of curators that look at these variants.”
Inherited Traits
23andMe provides eight results for ‘Wellness’ (how variants might affect your body’s response to food or exercise) while Veritas’s premium package (which scans 566 genes) files non-medical traits under ‘Other’ risks.
Both firms claim that I’m intolerant to lactose, the sugar found in dairy products, which can lead to diarrhoea if left undigested. But while my cells don’t make the enzyme required to digest lactose, gut bacteria will break it down and release gas, which is why lactose intolerance causes bloating and flatulence. While I haven’t noticed such effects, I’ve switched from cow’s milk to soya.
Biological Age
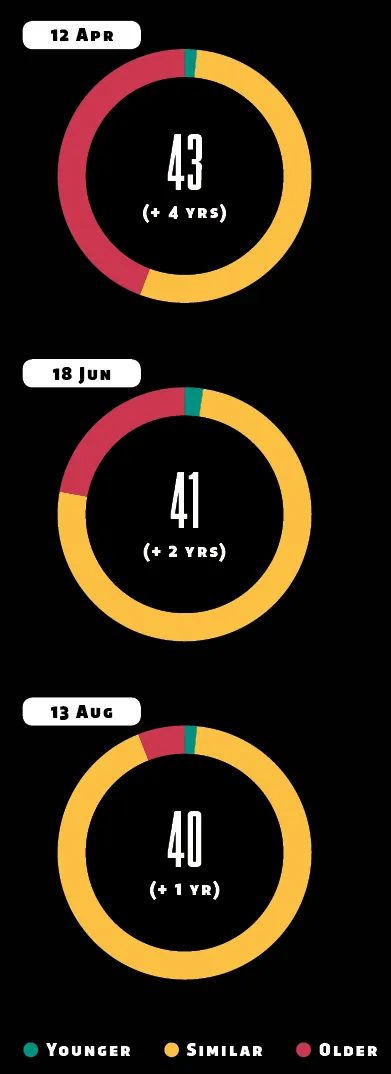
Chronomics displays a headline figure for ‘Biological Age’ – how old your body truly is in years – and the difference from your chronological age. The figure is calculated by reading epigenetic marks at 20 million locations to study the patterns of where those marks on DNA are lost and gained over time.
Another way to estimate age is from ‘telomeres’, protective caps at the ends of chromosomes, which get shorter as cells divide. But that approach doesn’t consider how genes on chromosomes affect ageing, argues Chronomics CEO Dr Tom Stubbs, “Epigenetics is capturing more aspects of biological age than just telomere length.”
Chromosome Ageing
The epigenetic marks used to calculate ‘Biological Age’ can be grouped according to whether they’re located on a chunk of DNA that contributes to being younger, similar or older than your chronological age.
Chronomics draws those chunks on a map of 23 chromosomes (representing pairs) coloured by age group. The company doesn’t yet show specific genes, but did provide a few examples upon request.
- ELOVL2: This gene is involved in producing beneficial polyunsaturated fatty acids and gains epigenetic marks with age, turning the gene’s activity off.
- AHRR: This gene is used to metabolise toxic hydrocarbons from cigarettes or air pollution and loses epigenetic marks with age, turning its activity on.
Epigenetic Indicators
Whereas genetic mutations that alter DNA letters are relatively rare, epigenetic marks are continuously added and removed throughout your lifetime. Whether your DNA has certain marks is influenced by the external environment, so epigenetics can indicate internal changes that influence health.
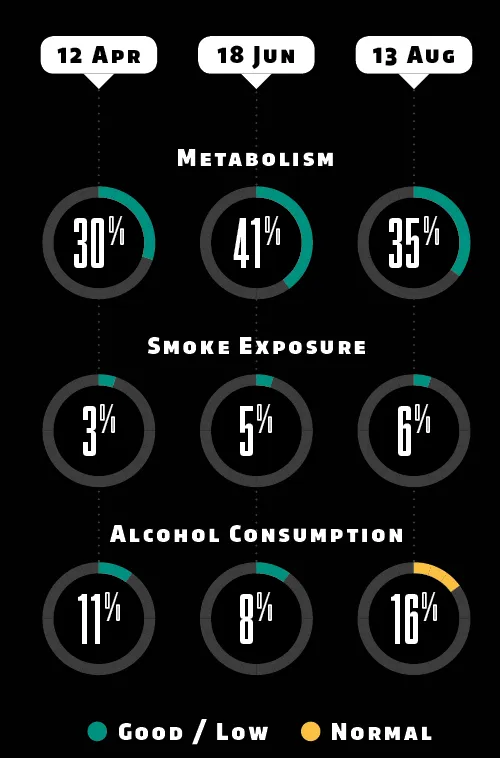
Using information that you provide (including mass, diet and exercise), Chronomics compares your marks to people with similar demographics to set a baseline for what you would expect to see in an unhealthy person (a score of 100 per cent) then calculates the state of your metabolism, smoke exposure and alcohol consumption.
Almost all my scores reflect the fact I’m a non-smoker, healthy weight, and drink responsibly.
So has home genetics testing told me anything?
Another thing that might make you anxious about biometrics is wondering if a DNA test will uncover inherited conditions, which has implications for, say, whether you can get life insurance.
My results for genetic variants that might raise the risk of disease were a relief (I probably won’t die tomorrow) and my epigenetic tests also show that my ‘biological age’ matches my chronological age.
3
Microbiome test
Atlas Biomed / From £99 / Turnaround: 2-6 weeks
The community of microorganisms that colonises a human body – the ‘microbiome’ – includes everything from bacteria and viruses to fungi. The microbiome contains hundreds of species of bacteria and individual microbes outnumber human cells by a ratio of (at least) 1.3 to 1. Your microbiome interacts with the body, which influences your physiology. Research suggests that a richer and more diverse microbiome is linked to a lower risk of disease.
Microbiome composition is unique to each individual. Atlas Biomed reads genetic sequences to determine the identity and proportion of the various bacteria that inhabit your gut.
After following handy instructions explaining how to sit on a toilet to ‘deposit sample’, you pop your poo in the post then wait for a report on Atlas Biomed’s website or app, which will later give a list of microbes and their relative abundances, plus scores related to health and nutrition.
Read more about genetics:
- High street genetic tests – Dr Michael Mosley reports
- Giles Yeo: Eating for your genes
- Can people have a genetic predisposition towards being evil?
The most important score is for ‘Microbiome Diversity Level’, which is higher in individuals on a plant-based diet. Food fibres are complex carbohydrates such as cellulose (found in nuts and wholegrain cereals, for example) that are digested to nourish microbes within the gut ecosystem.
“It’s not that we’re promoting a vegetarian lifestyle,” says Dr Dmitry Alexeev, Atlas Biomed’s head of microbiome research, “but we are trying to teach people about the importance of fibre.”
Disease Risks
Atlas Biomed gives risk scores that indicate how gut bacteria work with your body to protect against diseases. The five scores for ‘Microbiome Protection Level’ are on a relative scale of 1-10, normalised so 5 is average for the UK population. My scores suggest I have a low risk of developing five conditions.
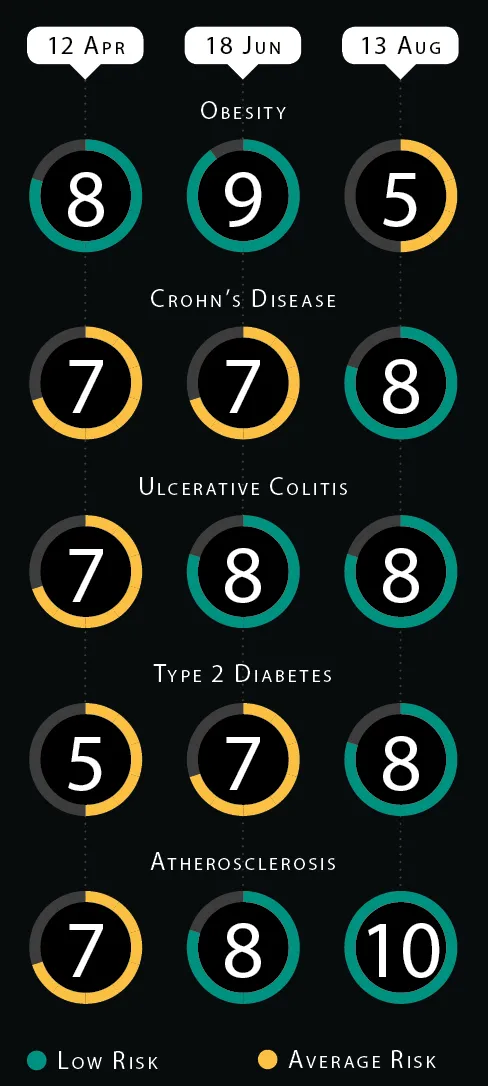
Nutrition
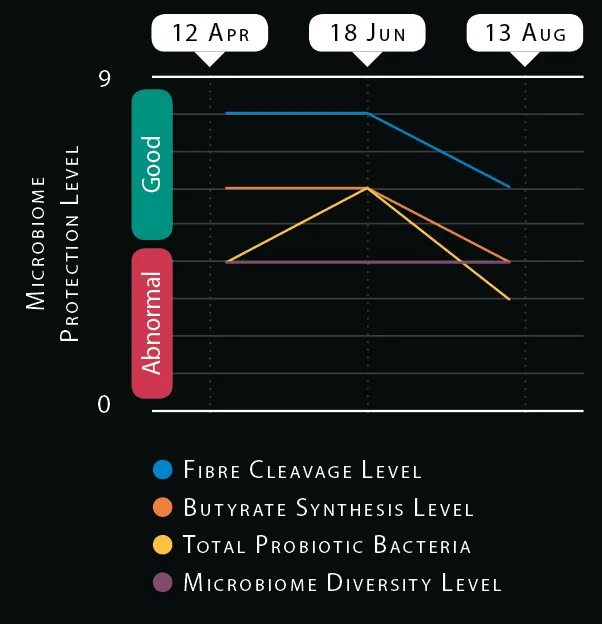
Bacteria break down dietary fibres and synthesise short-chain fatty acids such as butyrate, a source of energy for the gut ecosystem. High microbiome diversity makes that ecosystem dynamic yet stable, forming a buffer against opportunistic pathogens like E. coli, which can cause inflammation of the protective ‘mucous layer’ lining your gut.
Metabolic products like butyrate, produced by beneficial bacteria and other ‘probiotic’ microbes, can therefore be a sign of inflammatory conditions ranging from irritable bowel syndrome (IBS) to Crohn’s disease.
Atlas Biomed shows scores for probiotics, diversity and fibre metabolism. As my levels were all low or average, I should eat more vegetables to support my microbiome.
Enterotype
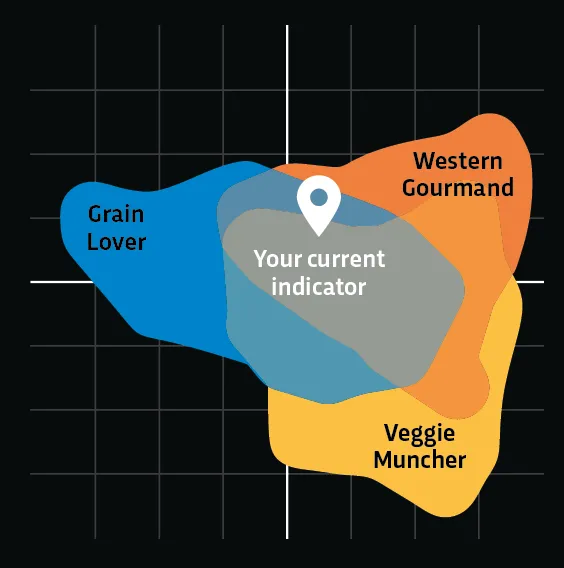
Microbiome composition can be classified into three clusters or ‘enterotypes’, each characterised by the presence of certain bacteria.
Because they’re linked to diets in different parts of the world, Atlas Biomed calls the types ‘Western gourmand’, ‘Veggie muncher’ and ‘Grain lover’.
The icon representing my type – Western gourmand – is apt because it’s my favourite food: pizza.
How does my microbiome look?
It’s less obvious how to interpret data from your gut. While there’s plenty of evidence that bacteria are somehow linked to disease risks, it’s unclear what ‘Microbiome Protection Level’ scores actually mean in terms of cause and effect.
Similarly, there’s no doubt that high microbiome diversity is beneficial to the human body, but adding desirable species isn’t straightforward (my genetic tests revealed lactose intolerance, for instance, so probiotic yoghurt isn’t ideal).
Nonetheless, changing habits is a low-risk health intervention, so I now avoid snacks containing refined sugar in favour of dried fruit and nuts.
4
Home metabolism testing
Thriva / From £24 / Turnaround: 1-2 weeks
The conventional way to assess health is through a blood test, sending your sample to an analytical chemistry lab to measure levels of biomarkers such as lipids (markers for cardiovascular disease).
Until recently that meant visiting your GP, who checks things like blood pressure before deciding whether to order a test. But companies like Thriva are now putting the power in your hands.
Using a disposable lancet, you prick a fingertip then collect your blood sample in one to two tubes. Be warned that if you want to test multiple markers, your blood will probably clot before you can fill a second tube (I tested over 20 different biomarkers so ended up having blood drawn via syringe at my local clinic).

Doctors will often check for signs of ‘metabolic syndrome’, a loose term for the combination of conditions that include obesity and diabetes. Your GP might plug factors like blood pressure and cholesterol levels into an equation to calculate your ‘QRISK score’, which predicts your risk of having a heart attack or stroke within the next 10 years.
My score is 1.4 per cent. At over 10 per cent, your GP may prescribe a statin to lower cholesterol. Personal blood tests provide many of the metrics needed to calculate scores yourself.
Lipids
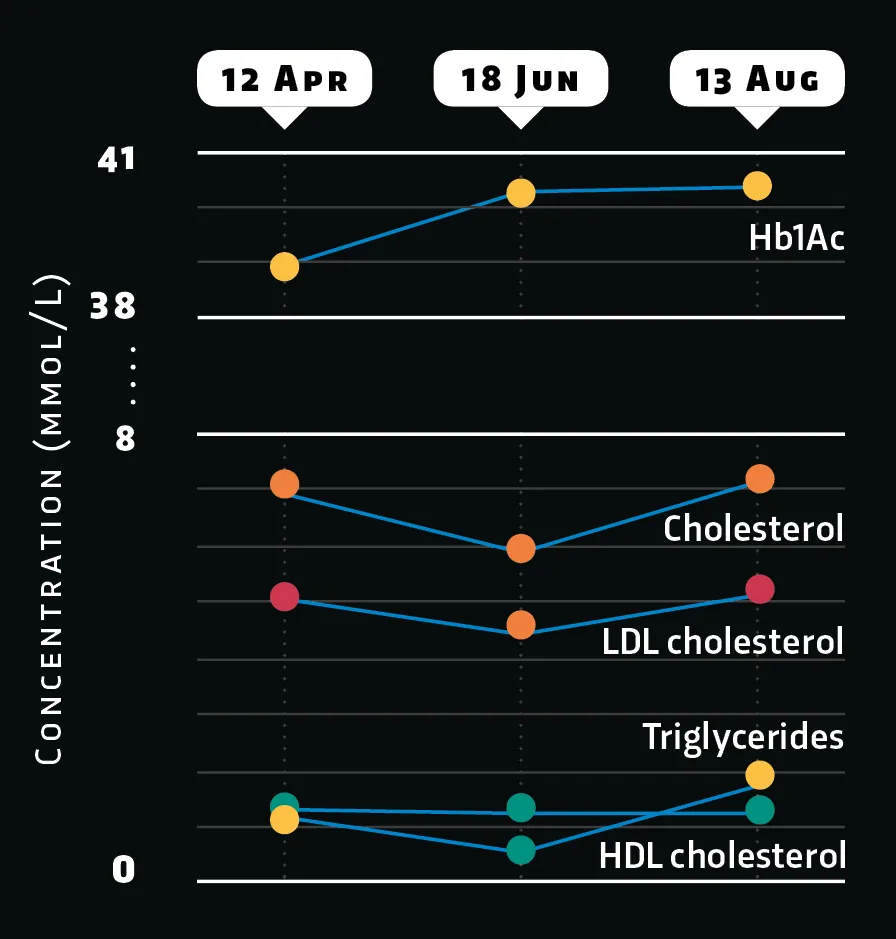
Fatty biomolecules come in various forms, from simple triglycerides to complex cholesterols, most notably HDL (high-density lipoprotein) – also known as ‘good cholesterol’ – and LDL (low-density lipoprotein) aka ‘bad cholesterol’.
Results from blood tests show that intensive exercise over summer caused a clear drop in my levels of unwanted LDL (without affecting HDL), demonstrating that increased physical activity helps fight circulating body fat.
For comparison, this line graph also plots HbA1c concentration, a measure of glucose that’s attached to haemoglobin, which indicates blood sugar and serves as a marker for diabetes.
Vitamins
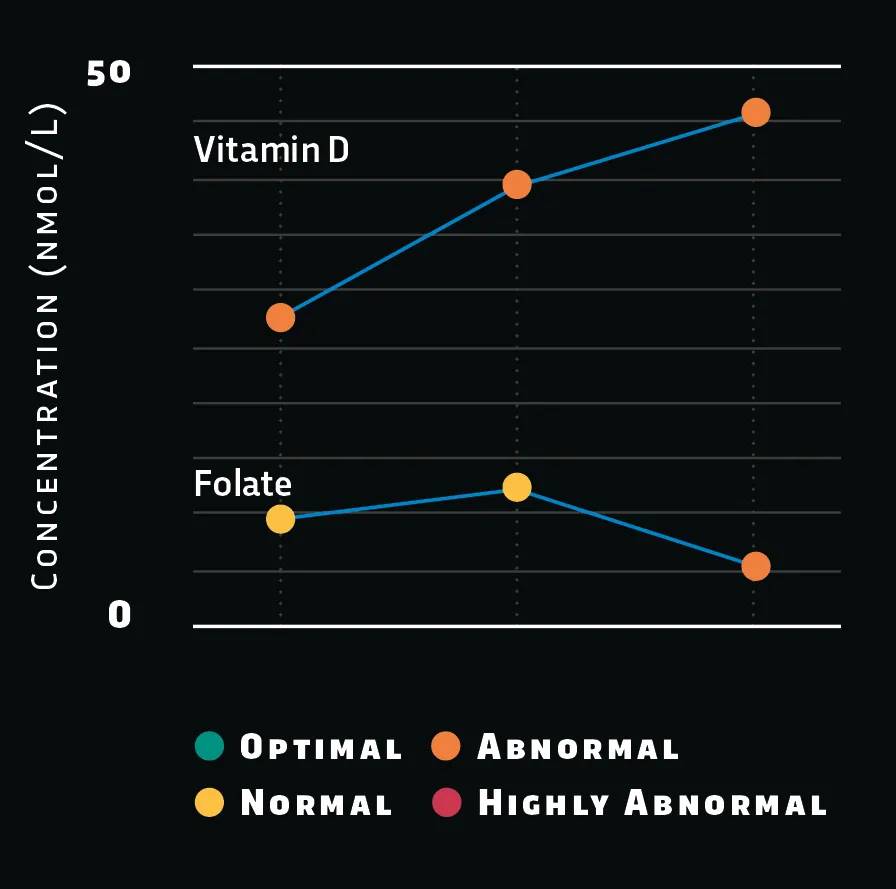
Vitamin B9 or ‘folate’ is vital for maintaining DNA. My folate level only became abnormal in the final test, while my active B12 (not shown) was always normal. I can increase folate simply by eating more leafy vegetables.
Vitamin D is made by your skin upon exposure to sunlight and lets the body absorb calcium, which is essential for building bones, muscles and immune function, and helps to prevent depression.
My vitamin D level was consistently low. Doctors say to get extra sunshine if your concentration is less than 50 nanomoles per litre, but mine is 45.8 (moderate deficiency), so my GP prescribed supplements.
So what do the biometrics say about me?
Metabolism, as measured via markers in my blood, also suggest that I have good overall health. My biggest concern was high levels of LDL or ‘bad’ cholesterol – a risk factor in atherosclerosis, a cardiovascular disease where the inside of arteries become narrow due to the build-up of plaques containing cells, fats and other material.
Doctors want your LDL concentration to be below five millimoles per litre, and blood tests highlighted my level as ‘highly abnormal’. But Dr Louisa Loughborough, my GP, disagrees. Hovering above five is “Ever-so-slightly raised,” she says. “Don’t worry about it.”
Conclusions
So which metrics are worth measuring? Each test has pros and cons. Some Fitbit users are motivated by goals like 10,000 steps a day, others will be demoralised when they miss such targets, while people like me won’t care about beating their personal bests.
Sleep tracking is a double-edged sword: you’ll gain awareness of sleeping patterns, but might also lose sleep over whether you’ve slept enough.
With DNA tests, 23andMe shows clear text and colourful diagrams but misses many genetic variants, while genome sequencing is a trade-off between choosing firms like Veritas Genetics to survey and interpret your variants versus downloading your own data, as offered by firms like Dante Labs, which sequences your genome for a similar cost but automates the interpretation.

Epigenetics has potential to provide actionable information, but Chronomics doesn’t yet present your results in an intuitive way.
Blood tests for metabolic markers reveal your current risk factors for future disease, but the charts include a hint of scaremongering and Thriva shifts the responsibility of interpretation from their doctors to your GP.
Improving your diet should boost your microbiome, but won’t necessarily protect you from illness.
While I wouldn’t give any biometric test a top rating, each has features that should be useful to someone, depending on your personal risk factors. After half a year of self-tracking, an annual health checkup already feels like an outdated system of measurement. It won’t be long before we all go metric.

